|
CATENARY : Generation
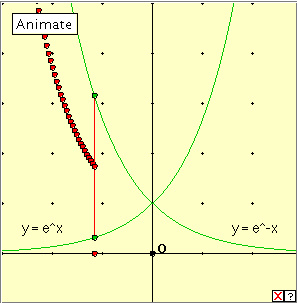
The applet below generates the catenary. It shows the graphs of the two exponential functions Click the linked diagram below, and then click the ‘Animate’ button to generate the catenary. Clicking the little x at bottom right will clear the drawing from the applet window. Now drag the red point slowly along the x-axis. Can you describe the construction? Reflection This applet, which involves a coordinate system and graphs of functions, is a little more complicated to program, but not much! Occurrences The best known occurrence of the catenary is that it gives the shape of a uniform flexible chain hanging freely under gravity.
Notice that this is not the same shape as that assumed by a flexible cable supporting a uniform load, as for example, in the case of a suspension bridge. In this case the curve assumed is a parabola. In this second case, the load is distributed horizontally; in the first case it is distributed along the cable itself.
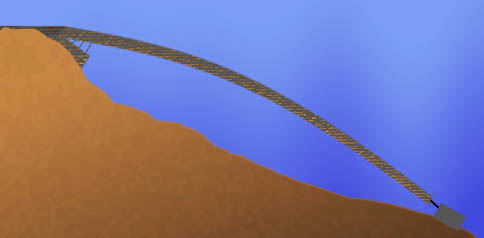
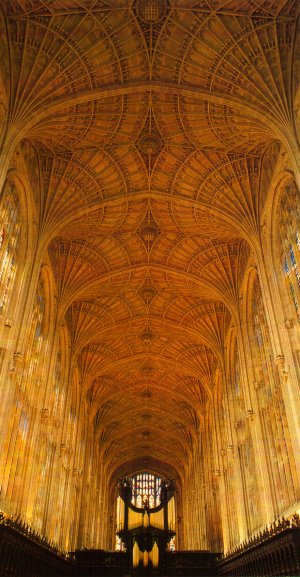
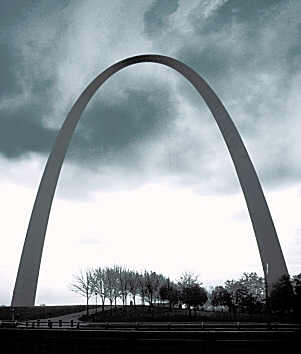
Two architectural examples of the catenary are in the supporting arches of the ceiling of King’s College, Cambridge, and the Gateway Arch in St Louis, Missouri, USA. This inverted catenary arch is 630 feet wide and 630 feet tall.
|
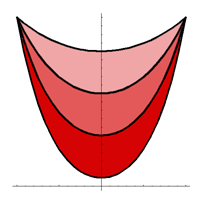 The catenary and its associated tractrix differ from the other curves we have considered in that they appear to have no simple means of generation. As we shall see later, the catenary is important because of its occurrence in real life. In this context it also appears as the average of two exponential curves, and we generate it this way in the applet below. The large smile at left is generated by four scaled catenary curves.