|
LEMNISCATE : Caustic curve
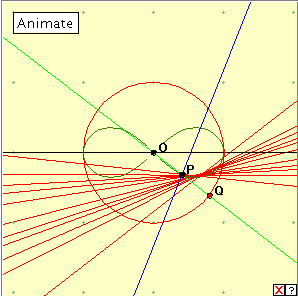
In the applet linked below, as Q traverses the red circle, point P describes the lemniscate. The caustic curve occurs as the envelope of the redd lines. Press the ‘Animate’ button to generate the caustic curve. You can delete this construction by clicking on the red cross at lower right. A fuller representation of the locus can be found by manually dragging the point Q fairly quickly around the red circle. What does the caustic curve look like here? |
 We take the locus of the lemniscate, and draw the normal from the centre O to the tangent at each point of the locus. The pedal curve with respect to O is the locus of the points of interesection of tangent and corresponding normal.