|
CATENARY : Pedal
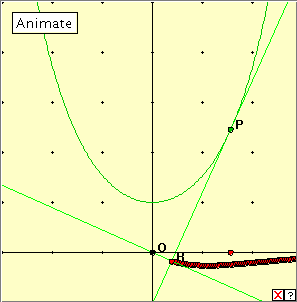
Click the diagram below to activate the applet, and then click the ‘Animate’ button, or manually drag the red driver point along the x-axis. Both methods give a good representation of the pedal curve. Do you recognize the pedal curve? Can you name it? describe it? It is in fact very difficult to find any reference to the pedal curve of the catenary. We could say it resembles a curve called the right strophoid. However this curve appears as the pedal curve of the parabola, so the resemblance occurs because of the similarity in shape of the parabola and the catenary. |
 To obtain the evolute of the catenary, we start with the catenary locus, and draw in the normals to points on the locus.