|
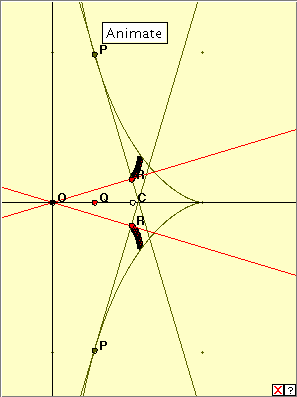
 As usual we find the pedal curve of this curve with respect to the origin O, by drawing the normal from O to the tangent at each point of the tractrix locus. The locus of the normal-tangent intersections generates the pedal curve of the tractrix. As usual we find the pedal curve of this curve with respect to the origin O, by drawing the normal from O to the tangent at each point of the tractrix locus. The locus of the normal-tangent intersections generates the pedal curve of the tractrix.
 Click on the linked diagram at right, and then click on the ‘Animate’ button. The red driver point Q moves along the horizontal x-axis, and correspondingly, the points P trace out the tractrix. The points R trace out the pedal curve. Do you understand the construction? Do you recognize the pedal curve here? Click on the linked diagram at right, and then click on the ‘Animate’ button. The red driver point Q moves along the horizontal x-axis, and correspondingly, the points P trace out the tractrix. The points R trace out the pedal curve. Do you understand the construction? Do you recognize the pedal curve here?
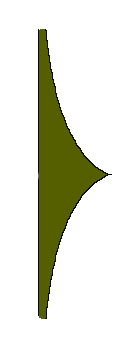
The pedal curve resembles one side of a butterfly’s wings. It is not a curve we have seen before.

|