|
|
|
||||||||||
|
|
|||||||||||
| The Mandelbrot set (I)
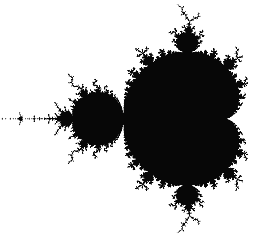
The Mandelbrot set is a set of complex numbers. Complex arithmetic is used to decide if any given c is in the set or not. Suppose we want to test a given c to see if it is in the Mandelbrot set. To do this, we set z0 = (0,0), and then calculate z1, z2, ... in turn using the formula: If the sequence {|zn|} stays within finite limits as n increases, then c is in the set. If {|zn|} grows without limit, then c is not in the set. The Mandelbrot set does not sound very spectacular. But let us use the computer screen to show part of the complex plane. Each possible value of c represents a point in the plane. If c is in the Mandelbrot Set, we colour the point black. If c is not in the set, we colour it white. The result is shown.
|
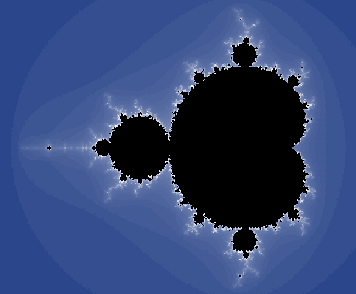
More interesting effects are achieved if we draw contours around the set. For the points outside the set, the values |zn| always get large, but at differing rates. We colour or shade the points outside the set depending on the rate at which they get large. Here is a picture of the Mandelbrot set with some coloured contours added.
 |
|
The Mandelbrot set (II)
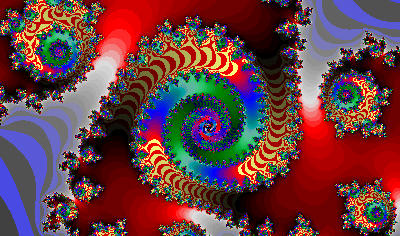
The boundary of the Mandelbrot set is a fractal of unbelievable complexity. As it is magnified, it reveals more and more detail. It contains smaller copies of the whole picture. Whereas other fractals we have studied are exactly self-similar, the detail of the Mandelbrot set is always different (see picture below). With careful choice of colour, images of great beauty and complexity can be produced. Exploring the Mandelbrot set in this way is a fascinating experience. The program on the next page gives a display of the Mandelbrot set with coloured contours.
|
The procedure mandelcolour works out the colour of point x,y on the screen. The procedure mandelbrot then calls mandelcolour for each point in a square region of the screen, and draws a dot of the appropriate colour. The primitive setc sets the colour of the turtle’s pen. The initial call to ht (hide turtle) sppeds the program up a bit. Varying xc, yc and scale parameters will display and magnify different parts of the set.
Some versions of Logo have the procedures dot and while built in. Dot draws a dot at the given position. The while procedure has two inputs and both of them are pieces of Logo program. The first is an expression whose value is true or false. While this expression is true, the second piece of program is repeated over and over again. The program takes some time to execute! 7. Watch the program in action. Which parts of the picture are faster and which are slower? Can you explain this? |
The program
|
|
||||||
|
Further investigations 8. Explore the Mandelbrot set by changing the parameters to magnify areas along the boundary of the set. Particularly interesting areas to explore are the ‘valleys’ between the main part of the set and the circular blobs attached to it. 9. Explore the ‘spike’ on the left of the set. By repeatedly magnifying the spike, see if you can guess how thick the spike is. 10. (Harder) How many integers, rational numbers, and real numbers are there? There are an infinite number of each, but how do these infinite numbers compare? How can these questions be investigated mathematically? How can we compare infinite numbers? Use your library. |
 Mandelbrot, Benoit (1924 - ) Mandelbrot is a French mathematician, born in Warsaw, Poland. He was largely self-taught and considered a maverick in the field of mathematics. He tends to rely on his talent for visualizing natural phenomena. He is a pioneer of chaos theory, which is used to find order in apparently erratic and chaotic processes. He also contributed to the development of fractal geometry. He is best remembered by the set which bears his name. |


 We can write z = x + iy as z = (x,y). Now z represents the point with coordinates x and y. Such points (x,y) form the complex plane. The diagram shows a point z = (x,y) in the complex plane.